

Highlights 10 years at a glance
-

Quarterly
Reports -

Annual
Reports -

Financials
Subsidiaries -

Limited Review Reports of Statutory Auditors
| (Amt. in ₹ crores) | |||||||||||
|---|---|---|---|---|---|---|---|---|---|---|---|
| Sl.No | For the year |
2016-17 |
2017-18 |
2018-19 |
2019-20 |
2020-21 |
2021-22 |
2022-23 |
2023-24 |
2024-25 |
2025-26 |
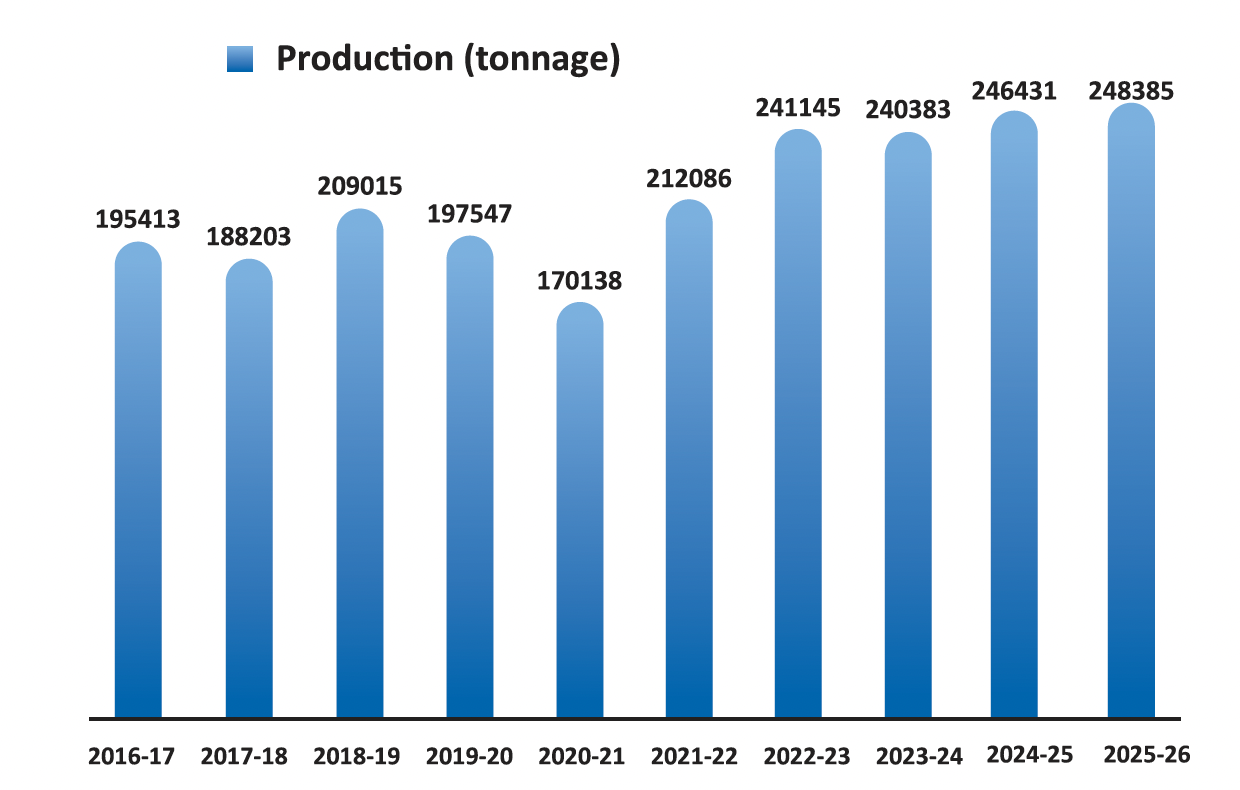
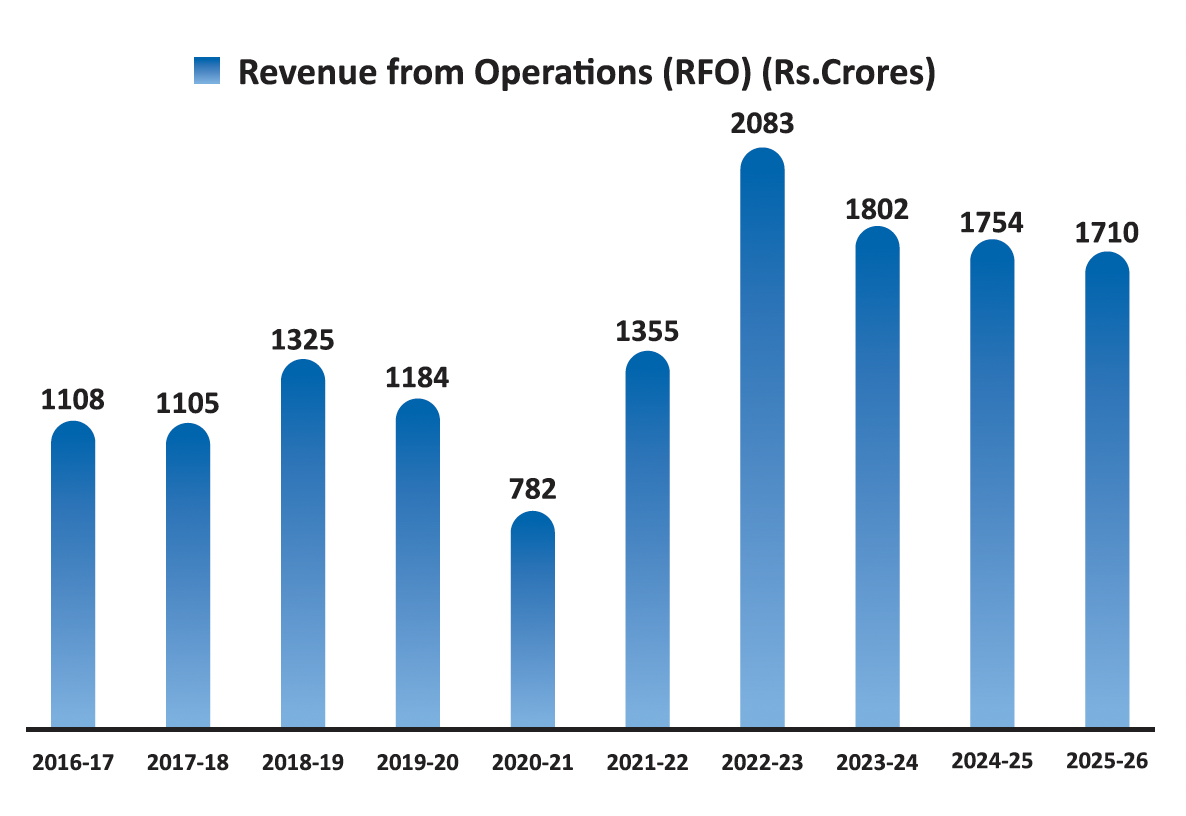
| 1 | Revenue from Operations | 1108 | 1105 | 1325 | 1184 | 782 | 1355 | 2083 | 1802 | 1754 | >1710 |
| 2 | Other Income | 8 | 9 | 23 | 23 | 19 | 17 | 31 | 51 | 70 | 49 |
| 3 | Total Income | 1116 | 1114 | 1348 | 1207 | 801 | 1372 | 2113 | 1853 | 1824 | 1760 |
| 4 | Total Expenditure | 894 | 897 | 1029 | 917 | 674 | 1189 | 1548 | 1462 | 1643 | 1614 |
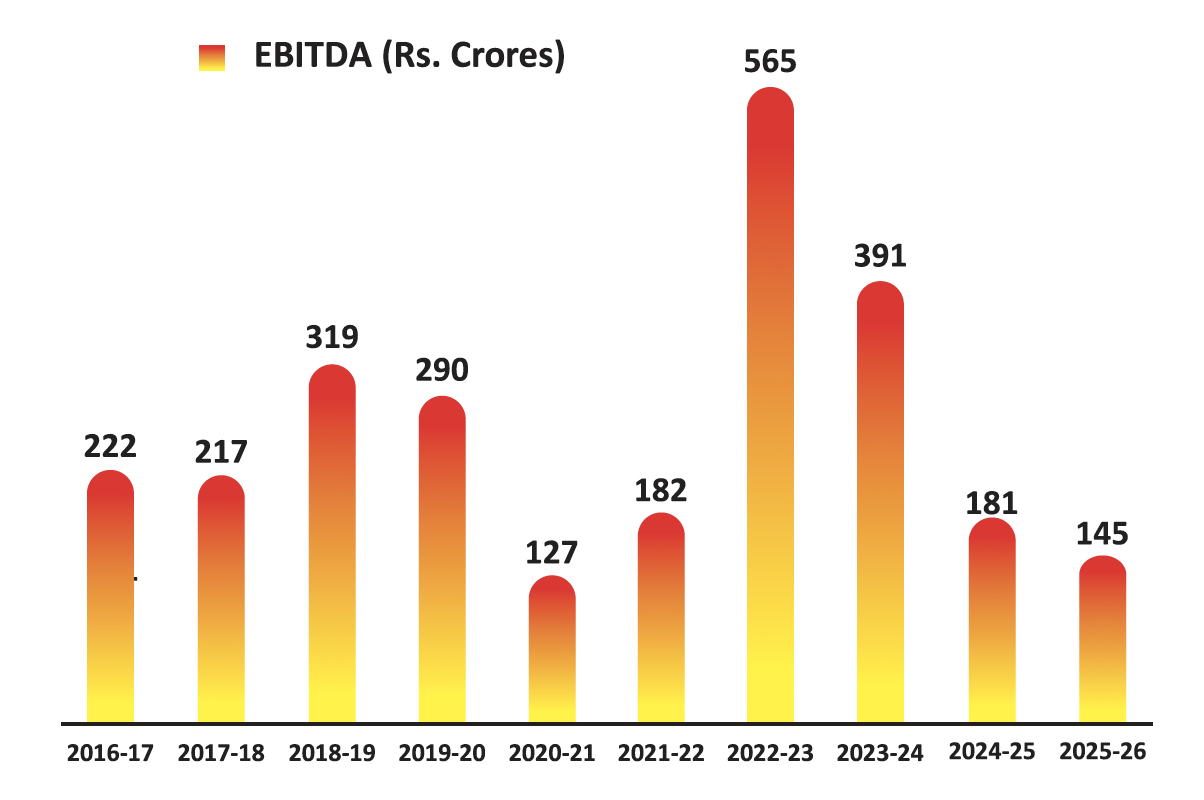
| 5 | EBIDTA (Rs. Crores) | 222 | 217 | 319 | 290 | 127 | 182 | 565 | 391 | 181 | 145 |
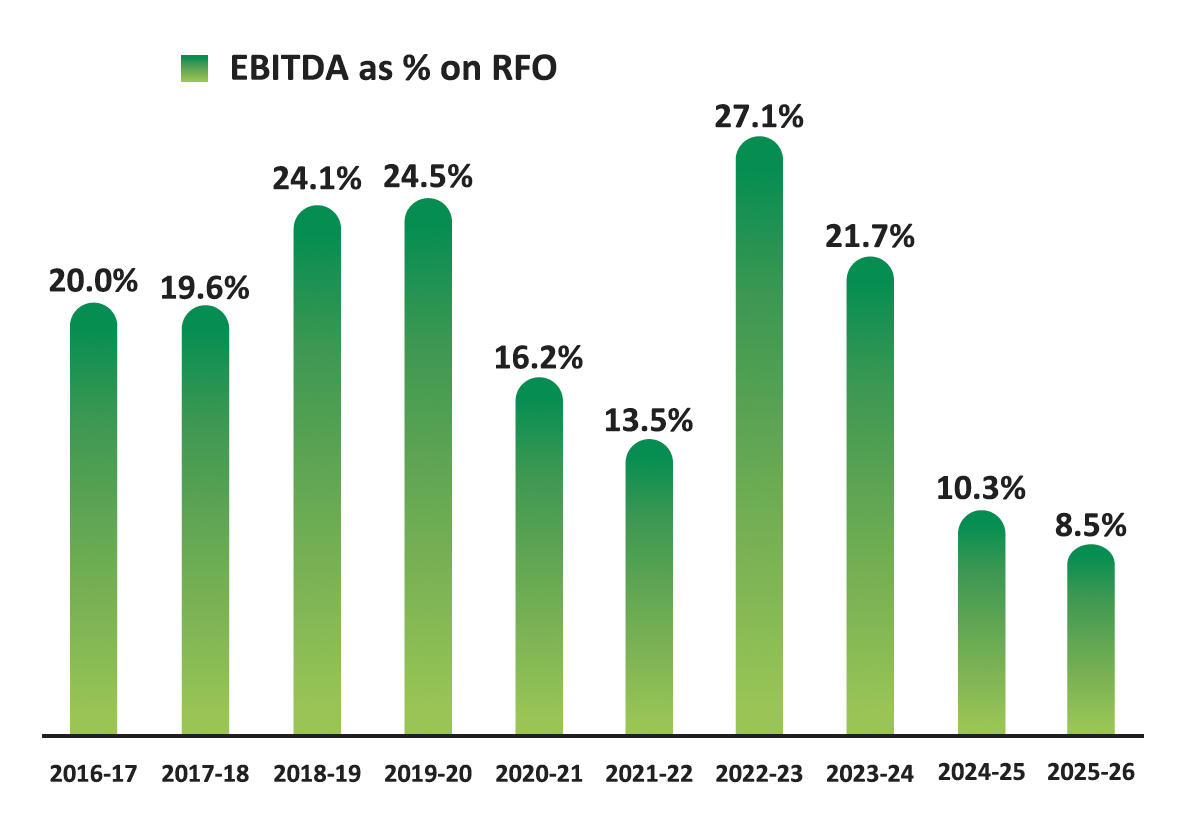
| EBIDTA % on RFO | 20.0% | 19.6% | 24.1% | 24.5% | 16.2% | 13.5% | 27.1% | 21.7% | 10.3% | 8.5% | |
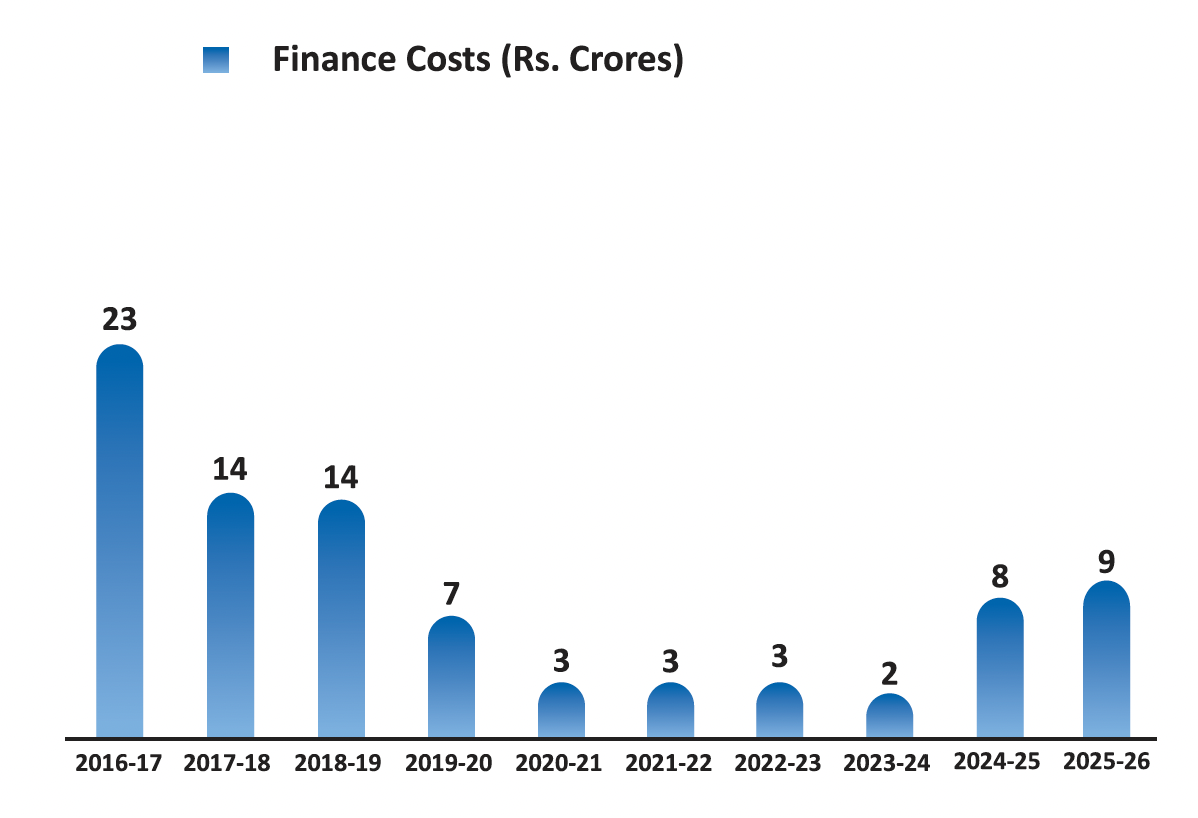
| 6 | Finance Costs | 23 | 14 | 14 | 7 | 3 | 3 | 3 | 2 | 8 | 9 |
| % on RFO | 2.1% | 1.3% | 1.0% | 0.6% | 0.4% | 0.2% | 0.2% | 0.1% | 0.5% | 0.5% | |
| 7 | Depreciation | 31 | 32 | 34 | 35 | 38 | 41 | 45 | 44 | 45 | 45 |
| 8 | Exceptional Item | - | - | 5 | - | - | - | - | - | - | - |
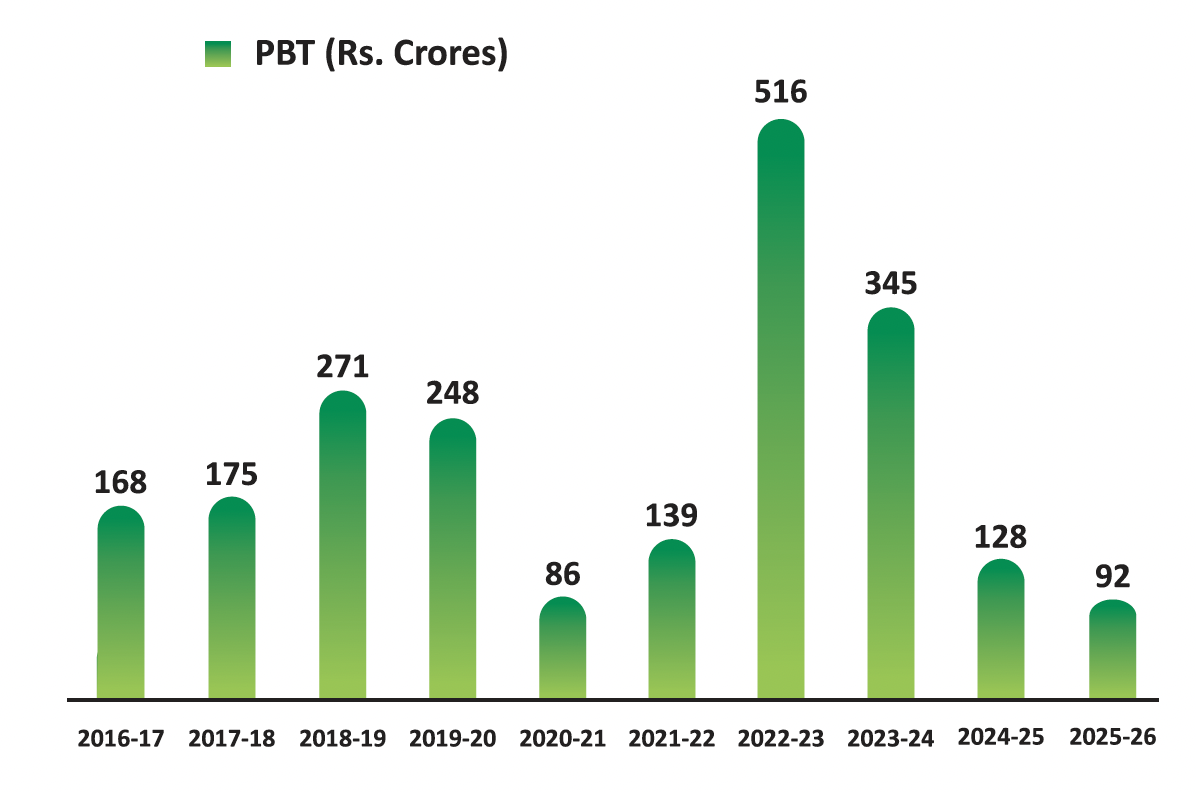
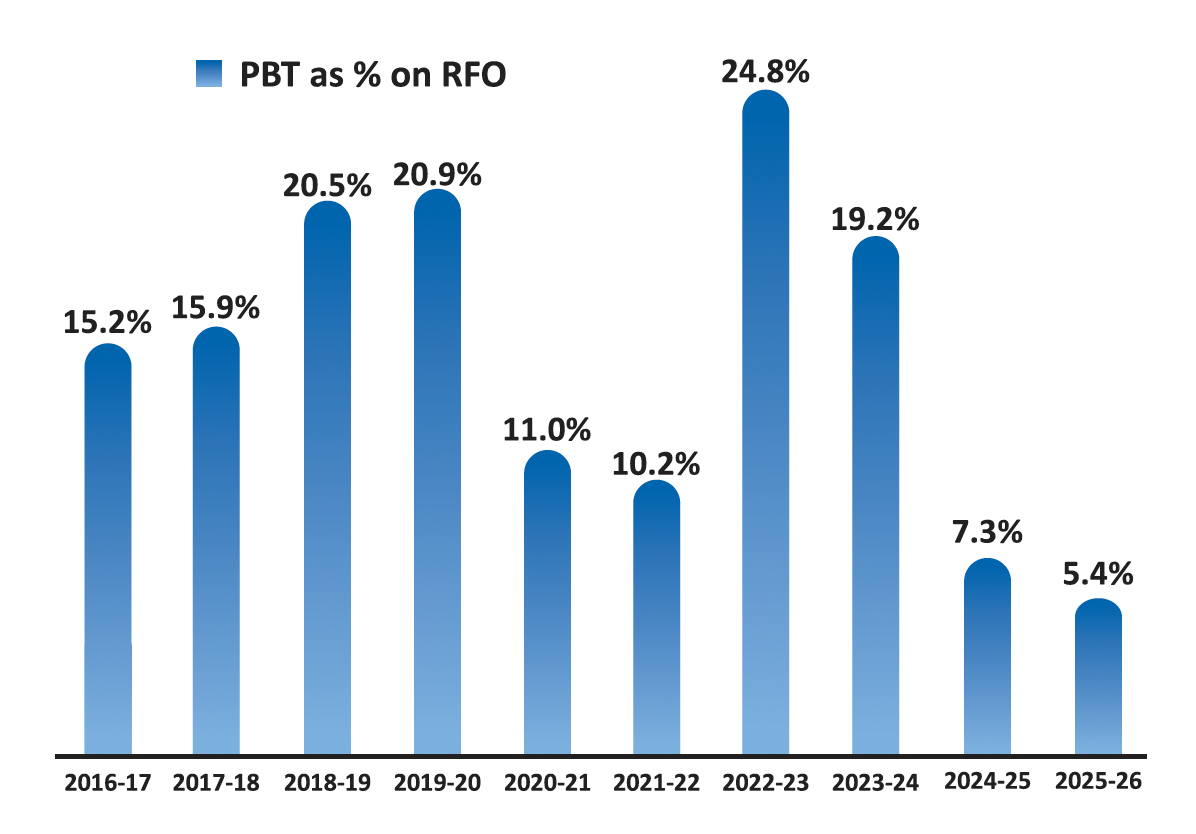
| 9 | PBT (Rs. Crores) | 168 | 175 | 271 | 248 | 86 | 139 | 516 | 345 | 128 | 92 |
| PBT % on RFO | 15.2% | 15.9% | 20.5% | 20.9% | 11.0% | 10.2% | 24.8% | 19.2% | 7.3% | 5.4% | |
| 10 | Tax expense | 40 | 52 | 81 | 74 | -14 | 35 | 130 | 86 | 23 | 24 |
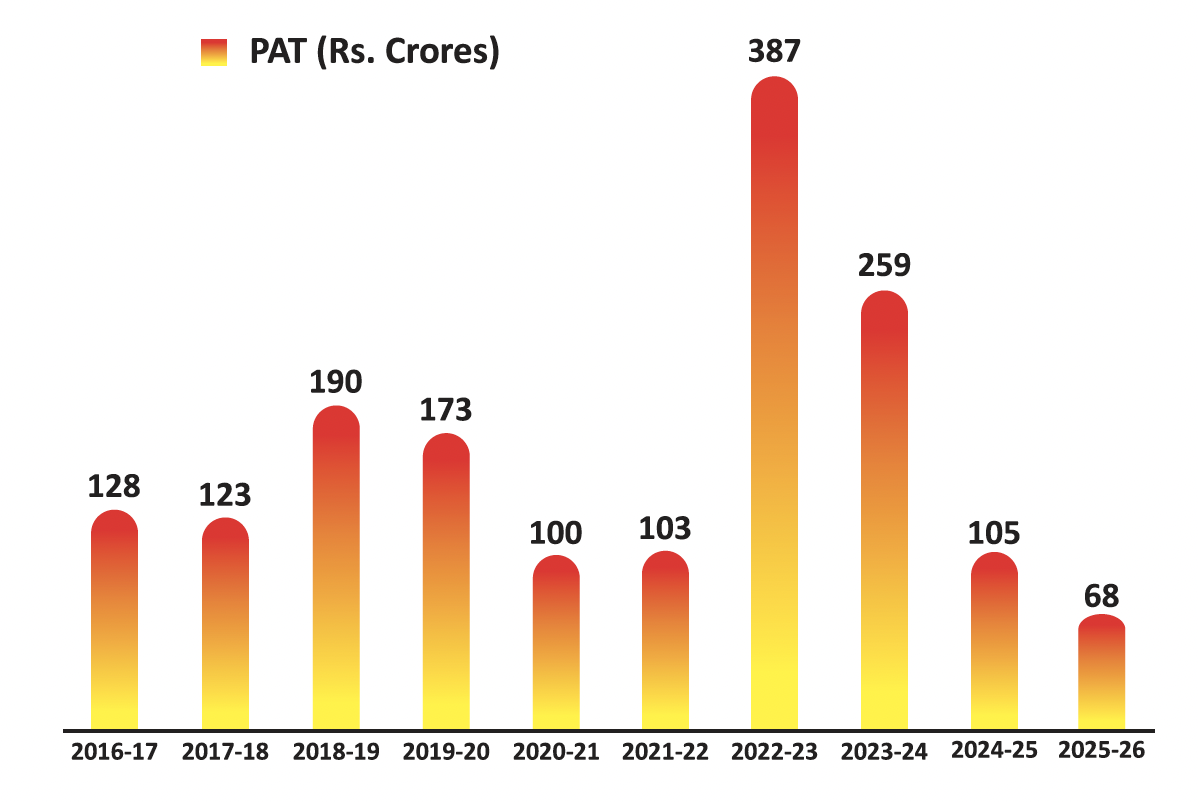
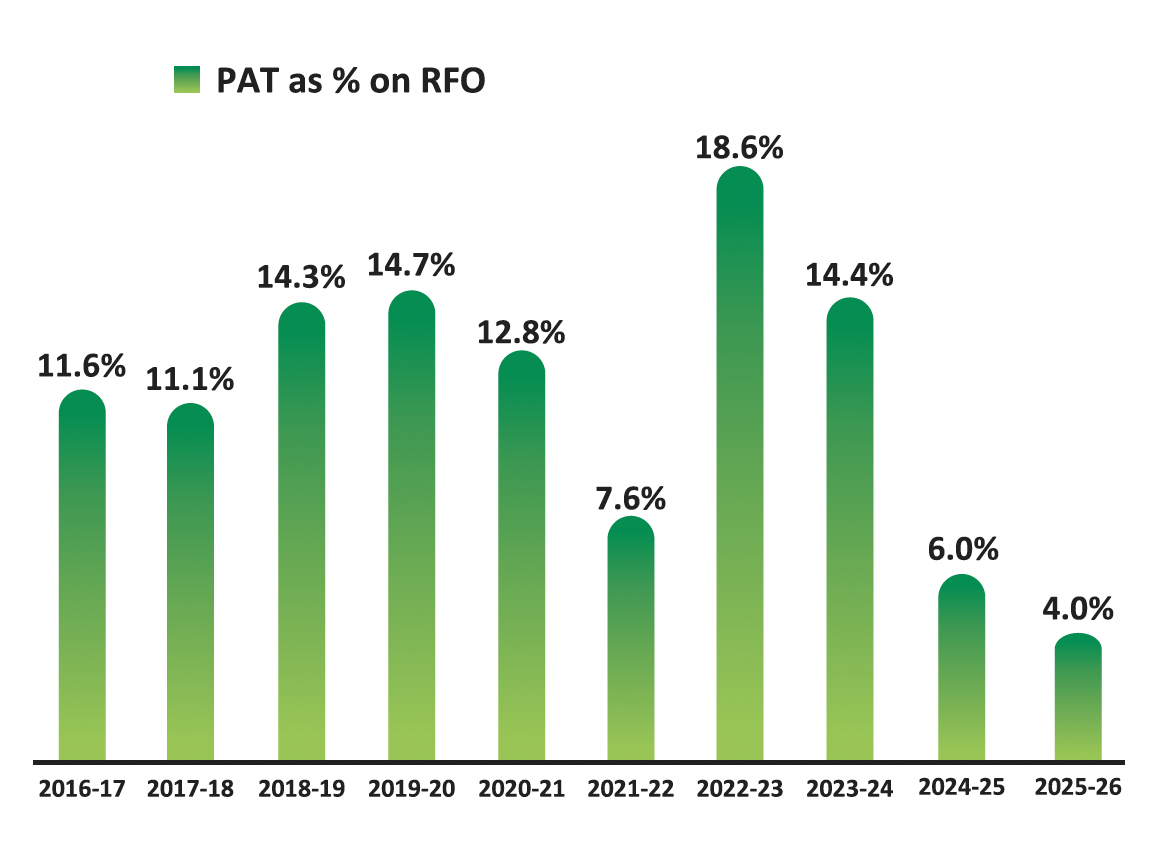
| 11 | PAT (Rs. Crores) | 128 | 123 | 190 | 174 | 100 | 103 | 387 | 259 | 105 | 68 |
| PAT as a % on RFO | 11.6% | 11.1% | 14.3% | 14.7% | 12.8% | 7.6% | 18.6% | 14.4% | 6.0% | 4.0% | |
| (Amt. in ₹) | |||||||||||
| 12 | EPS - Rs. ** | 21.26 | 20.40 | 31.55 | 28.80 | 16.65 | 17.12 | 64.18 | 43.06 | 17.36 | 11.25 |
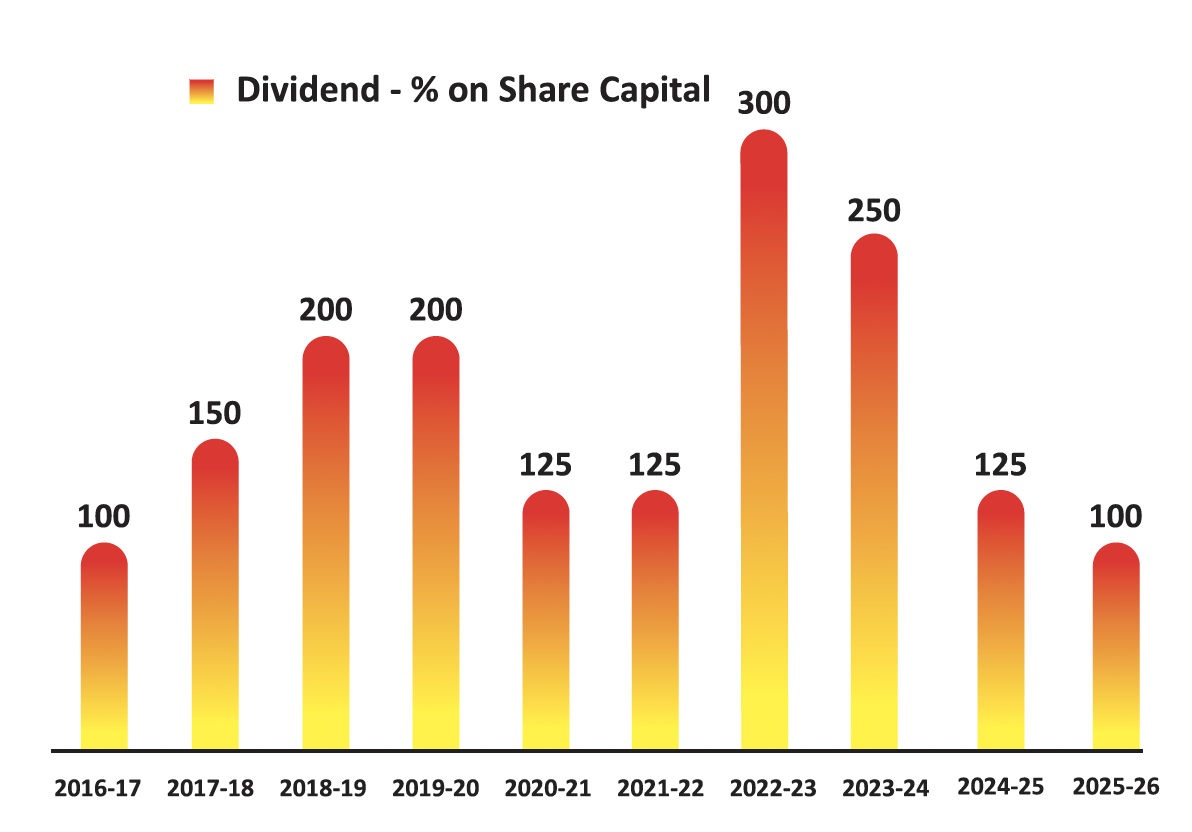
| 13 | Dividend - % on Share Capital | 100 | 150 | 200 | 200 | 125 | 125 | 300 | 250 | 125 | 100 |
| (Amt. in ₹ Crores) | |||||||||||
| 14 | Net Block | 637 | 673 | 672 | 675 | 734 | 815 | 796 | 776 | 756 | 745 |
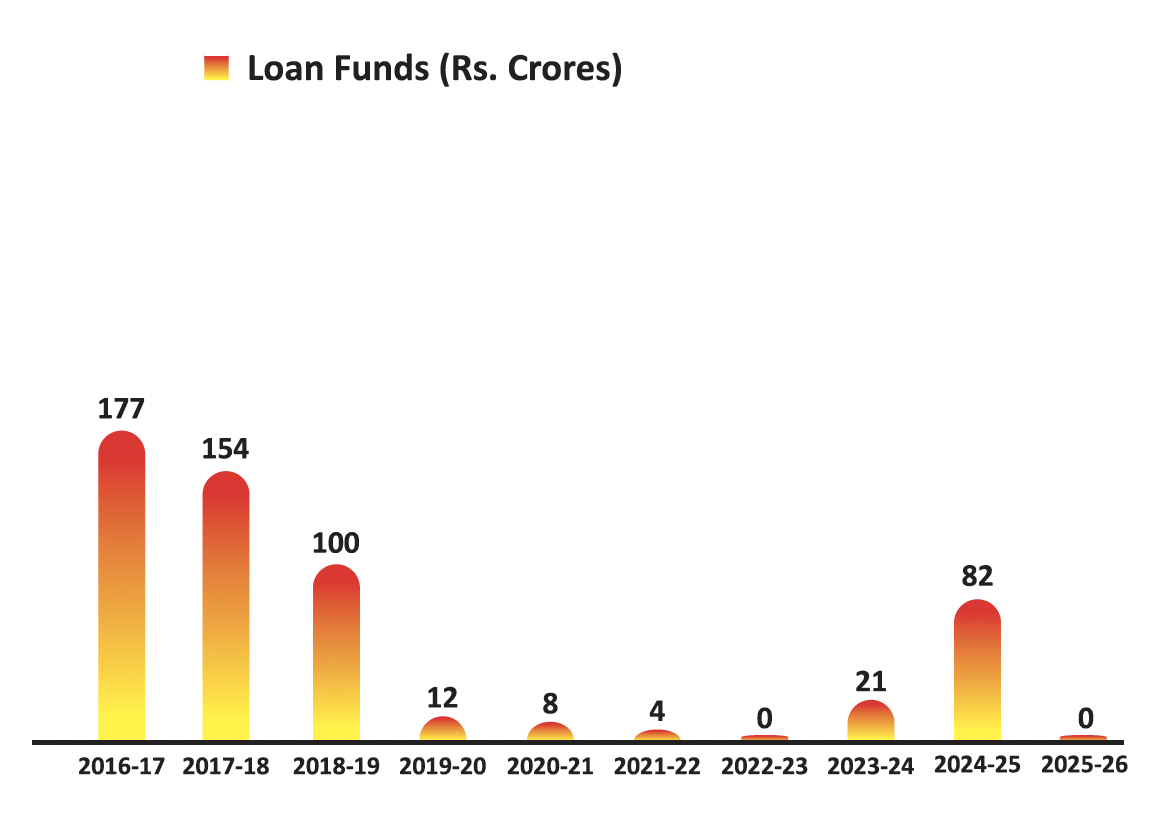
| 15 | Loan Funds | 177 | 154 | 100 | 12 | 8 | 4 | 0 | 21 | 82 | - |
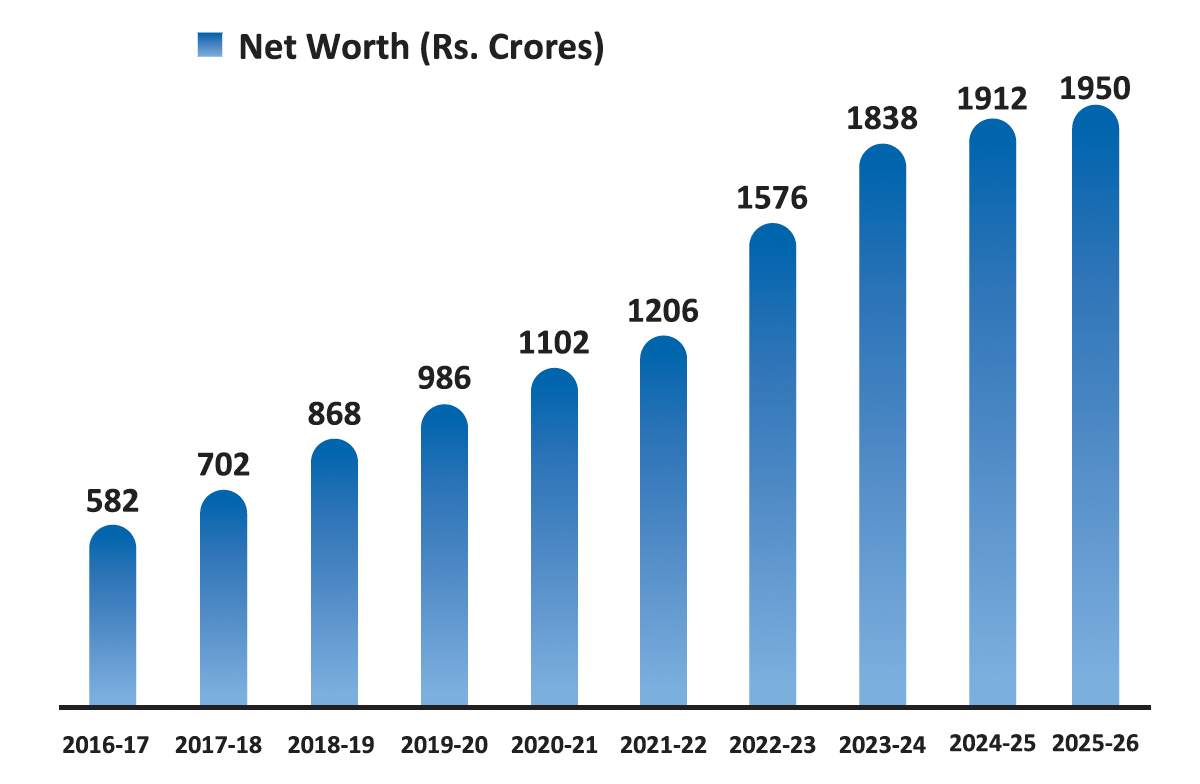
| 16 | Net Worth (Rs. Crs.) | 582 | 702 | 868 | 986 | 1102 | 1206 | 1576 | 1838 | 1912 | 1950 |
| (Amt. in ₹) | |||||||||||
| 17 | Book Value per Share - (Rs) | 97 | 116 | 144 | 164 | 183 | 200 | 262 | 305 | 317 | 324 |
|
Note 1: ** Consequent to the approval of the shareholders of the Company in the Annual General Meeting held on July 27, 2019, the Company had completed sub-division of Equity Share of face value of ₹ 10/- (Ten) each fully paid up into five Equity Shares of face value of ₹ 2/- (Two) each fully paid up. This sub-division was made effective August 21, 2019 (with August 20, 2019 as Record Date). ** For comparison purposes, the per share value of EPS and book value of the 10 years, restated for face value equivalent to ₹ 2/-(Two) per share. Note 2: EPS is calculated by dividing the profit or loss attributable to equity shareholder by the weighted average number of equity shares outstanding during the period. For the purpose of computation of weighted average number of equity shares outstanding, the number of equity share held by SPB Equity Shares Trust (2840905 shares) in the Company, is reduced. |
|||||||||||